 Appendix B: Frameworks for Organizing Indicators Appendix B: Frameworks for Organizing Indicators
There are hundreds if not thousands of indicators that could potentially be used to measure sustainable forestry and sustainable forest management. Deciding how many and which ones to use can be difficult. More is not always good; less is not better. The right number depends on factors including what type of audience the indicator report will have, how much time is available to research the data, the number of issues involved, and the specific needs of the community.
In addition, just as important as how many indicators are needed is what type of indicators are needed. Because there are many different stakeholders in a community, there is a need for different types of indicators and a way to balance the interests of those stakeholders. The selected indicators reflect all the key aspects of community sustainable forestry, not just a subset of the issues.
An indicator framework is a way to organize a set of indicators so that the resulting information including connections between different issues can be better understood. Much the same as the frame of a house provides support and a structure for the building, a framework for a set of indicators provides structure and support for the issues that the indicators are intended to measure. Sorting indicators into categories will quickly show which issues are being covered and which issues have been overlooked.
The Montréal Process C&I is the main framework discussed in this ToolKit. However, there are several other frameworks that can also be useful in organizing sustainability indicators. This appendix provides an overview of some of the more frequently used frameworks, some of which are listed below. Depending on where a community is in the process of developing and using indicators and what its needs are, some of these frameworks might be useful in addition to the Montréal Process Criteria and Indicators.
B.1 Montreal Process Criteria and Indicators
B.2 Community Capital Framework
B.3 Goal-based Framework
B.4 Pressure-State-Response Framework
B.5 Input-Output-Outcome-Impact Framework
B.6 Lowell Center Indicator Hierarchy
B.7 USFS Local Unit Criteria and Indicator Development (LUCID) framework
B-1. Montreal Process Criteria and Indicators
The Montréal Process Criteria and Indicators Framework was developed by the Working Group on Criteria and Indicators for the Conservation and Sustainable Management of Temperate and Boreal Forests. The Working Group was formed in Geneva, Switzerland, in June 1994 to develop and implement internationally agreed criteria and indicators for the conservation and sustainable management of temperate and boreal forests.
The Montréal Process Working Group developed the framework to provide its member countries with a common definition of what characterizes sustainable management of temperate and boreal forests. The framework includes seven criteria or categories of "conditions or processes by which sustainable forest management may be assessed." Each criterion has associated indicators that can be used to measure changes in the condition or process. Table B-1 lists the criteria and shows the number of indicators that were developed by the Working Group for each criterion. Specific examples of Montréal Process Indicators are included in Appendix E.
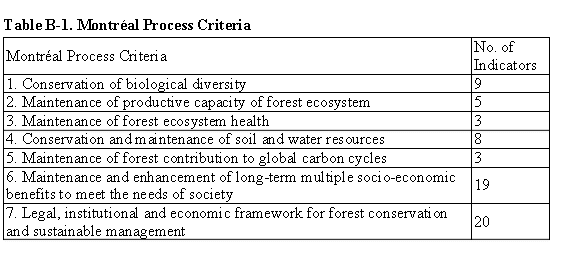
Using the Montréal Process C&I framework is beneficial for a community that is primarily interested in evaluating the sustainability of its forest resources. This framework helps to:
- develop a common language among the participants and organizations involved and
- develop a common understanding of the types of baseline conditions and trends in forests and other natural resources that need to be considered.
As a starting point, the criteria portion of the framework may be most useful because, although every community is different, the criteria form a common structure for discussing key issues related to forest sustainability.
More information about the Montréal Process C&I can be found on www.mpci.org.
B-2. Community Capital Framework
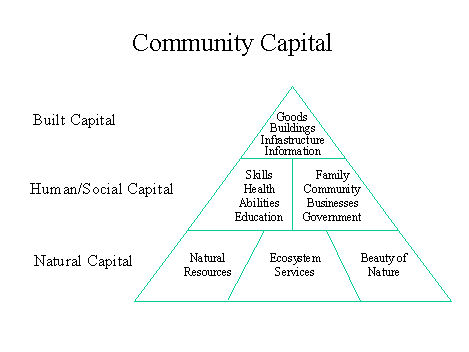
Community Capital refers to those things a community has that allow its inhabitants to live and interact productively. There are three main types of community capital - natural, social, and built. These form the basis of this framework:
- Built and financial capital: manufactured goods, equipment, buildings, roads, water supply systems, jobs, information resources, and the credit and debt of a community.
- Human and social capital: the people in the community, their skills, education and health, as well as their ability to cooperate and work together.
- Natural capital: the natural environment, which includes natural resources (both renewable and nonrenewable), the services that the ecosystem provides (e.g., purification of air and water), and the life-enhancing qualities of nature (e.g., aesthetics).
All three types of capital are necessary for communities to function. All three types of capital need to be managed by a community. All three types need to be cared for, nurtured and improved over time.
Community capital can be thought of as a triangle or a pyramid illustrated in Figure B-1.
Figure B-1. Community capital framework
The community capital framework helps to identify indicators that may be immediately useful to decision-makers. It is most often used and more appealing than the other general frameworks as it is simpler and deals with the relevant issues directly. However, it does not necessarily show the linkages between the different issue areas and does not explicitly include goals (although a community may decide to come up with goals for each issue area).
For more information on this framework and specific examples see "Guide to Sustainable Community Indicators", Second Edition, 1999, by Maureen Hart.
B-3. Goal-based Framework
Use this framework when you have clearly set vision and goals and you want to find out what you can measure to determine whether you are getting closer or further away from these goals. This framework helps develop indicators using the sustainability objectives taken from a stated vision or set of goals, such as maintenance of forest contribution to global carbon cycles, sustaining natural resources. Its main disadvantage is that the set of goals may not be comprehensive covering all important issue areas within a community. Furthermore, coming to a consensus about a common vision or a set of goals may be difficult in some cases.
One example of applying the goal-based framework for developing indicators is the Alberta matrix. Although no longer active, the Alberta Round Table on the Environment and Economy produced a report, Creating Alberta's Sustainable Development Indicators (September 1994), which provides an excellent description of the process of developing indicators. The indicators themselves are published in the Report of the Alberta Round Table on Environment and Economy (May 1993). The Report provides very clear descriptions of the indicators chosen and a goal-indicator matrix that shows the interconnections between the different issues of concern in Alberta. The work of this group has been taken over by the Alberta Treasury Department, in Edmonton, Alberta. The Treasury produces an annual report Measuring Up, which includes a number of indicators developed by the Round Table (for more information see www.finance.gov.ab.ca/measuring/index.html).
The government of Alberta has an ongoing three-year business plan that focuses government's efforts on three core businesses: People, Prosperity and Preservation. The plan sets out goals for each of the core businesses with key strategies for achieving each goal, and core measures to track performance results. For example, the 2000-2003 Government Business Plan has 19 goals and 27 core performance measures. Specific targets are set for each of the government's core performance measures. Each year in Measuring Up, results are reported for each measure relative to the target that has been set. These results are used as indicators of the government's progress towards achieving its goals.
Table B-2 is an excerpt from the 2000-01 performance results (for more information see: www.finance.gov.ab.ca/publications/measuring/measup01/intro.html)
Table B-2: Alberta 2001 Performance indicators (an excerpt)
PRESERVATION
| # |
Goals |
Measures |
Changes |
Results |
| 14 |
Alberta will be a safe place to live and raise family. |
Crime Rate |
No significant change from previous year |
In 1999, the gap between the national property crime rate and the Alberta rate increased by 3.4%, while the gap in violent crime rate decreased by 1.1% |
| 15 |
Alberta's natural resources will be sustained. |
Resource Sustainability |
No significant change from previous year |
Alberta's timber harvest remained below the annual allowable cut. Farm crop yield decreased to 0.86 tons per acre. |
| 16 |
The high quality of Alberta's environment will be maintained |
Air Quality |
No significant change from previous year |
In 2000, there was no change from 1999 in the number of days rated as "poor" or "very poor". |
| |
|
Water Quality |
Improved performance (5% higher) |
Water quality downstream of Edmonton, Calgary and Lethbridge is improving due to upgraded wastewater treatment facilities in each of these cities. |
| |
|
Land Quality |
Declining performance (5% lower) |
Farm crop yield decreased 0.16 tons per acre to 0.86 tons per acre in 2000. |
| 17 |
Albertans will have the opportunity to enjoy the providence's natural, historical and cultural resources. |
Heritage Appreciation |
No significant change from previous year |
Visitations to provincial parks and recreation areas and to provincially owned historic sites, museums and interpretive centers remained relatively constant. |
| 18 |
Alberta will work with other governments and maintain its strong position in Canada. |
Intergovernmental Relations |
Declining performance (5% lower) |
In 2000, the Alberta government's approval ratings in federal-provincial relations was 15% higher than the four-province average, down from 1999. |
| 19 |
The well-being and self-reliance of Aboriginal people will be comparable to that of other Albertans. |
Under Development |
New goal/measure |
Measure under development. |
B-4. Pressure-State-Response Framework
Developed by the OECD (Organization for Economic Cooperation and Development) in 1994 this framework has been widely used when developing and using environmental and sustainability indicators.
The pressure variable describes the underlying cause of the problem. The pressure may be an existing problem (for example, soil erosion in cultivated uplands, air pollution from buses) or it may be the result of a new project or investment (for example, loss of mangrove forest from port development). Whatever the cause, pressures affect the state of the environment and then may elicit responses to address these issues (see Figure B-2).
The state variable usually describes some physical, measurable characteristic of the environment. Ambient pollution levels of air or water are common state variables (e.g., PM10 in mkg/m3 or BOD loads to measure water pollution). For renewable resources such as forests, the measures used include: the extent of forest cover, the area under protected status, the size of an animal population, or grazing density.
The response variables are those policies, investments, or other actions that are introduced to solve the problems. Some examples include: providing incentives for sustainable forest management, introducing certification system for timber products, restricting hunting and fishing to some areas and times of the year, etc.
Below are provided some examples of indicators within the PSR framework.
Figure B-2. P-S-R framework
For additional information on the Pressure-State-Response framework (and the Driving Force-State-Response, which is a modification of it) see http://lead.virtualcentre.org/en/dec/toolbox/Refer/EnvIndi.htm.
Table B-3 Sample Sustainable Forestry Indicators
Preliminary work from Baltimore County
Organized using
Pressure-State-Response Framework
|
Goals
|
Pressure
Indicators
|
State
Indicators
|
Response
Indicators
|
|
Issue: Loss of forest and
tree cover
·
Increase
overall forest and tree cover in the county for multiple benefits
·
Identify the
most significant forests for biological diversity and provide long-term
protection through public ownership, protective easements, and appropriate
management.
|
·
% of total
forest and tree cover lost annually due to development
|
·
Acres of forest
and tree cover
·
% of total area
that is forest and tree cover
|
·
% of large
forest blocks in public ownership or protected through conservation easements
|
|
Issue: Increasing forest
fragmentation and impacts on biodiversity
·
To reduce
forest fragmentation due to changes in land use.
·
To expand and
connect existing forest patches through reforestation
·
To maintain
forest areas most critical for survival of forest dependent species.
|
·
Ratio of
forests protected vs. cleared for implementation of the Forest Conservation
Act
|
·
Acres or % of
forest in large forest blocks, or other block/patch size indicators.
·
Number or % of
threatened, rare, vulnerable, endangered or extinct species
|
·
Acres of
interior and exterior forest gaps reduced through reforestation
·
Forest acres managed as State wildlands
|
|
Issue: Impacts of forest
harvesting
·
Assess the
condition and quality of existing private forests
·
Complete forest
management plans for all large forest block/patches, especially those
targeted for timber harvesting
|
|
·
Acres harvested
by type of silvicultural practice (acres managed
for timber production or with potential for timber production)
·
Acres of forest
by soil woodland classes
|
·
Acres managed
for potential timber production as determined from range of silvicultural practices as determined in forest
management plans
|
|
Issue: Large deer
population
·
Protect forest
health from the impacts of deer over-population
|
· Acres of deer habitat lost to development
|
·
Car accidents/
incidents involving deer
·
Vegetation
assessment results
|
·
Number of deer
harvested
·
Acres of
habitat protected
|
|
Issue: Decline in soil and
water resources
·
Increase forest
cover at the watershed and sub-watershed levels in accordance with forest
cover thresholds for each land management area (rural-source water
protection, rural –working lands, rural residential,
developing suburban) and in accordance with thresholds associated with high
levels of source water protection.
|
·
Percent or
acres of forest cover lost annually
|
·
Status of
forest cover by watershed according to management type and thresholds
·
Average level
of phosphorous in the reservoirs.
·
% of forest
cover threshold by subwatershed for each of the
three metropolitan drinking water reservoirs
|
·
Acres of
agricultural and conservation zoning
|
|
Issue: Decline in soil and
water resources
·
Protect and
increase riparian forest cover, especially 100-foot and greater forest buffers
for headwater (1st and 2nd order) streams.
|
|
·
% of 1st
and 2nd order streams with 100-foot or greater forest buffers
|
·
Stream miles
protected during the land development process
|
|
Issue: Maintaining
watershed hydrology
·
Determine the
relationship between forest cover and groundwater recharge
|
·
Total water use
in county and/or gallons of water per resident
|
·
Number of
replacement wells by sub-watershed in relation to forest cover.
|
|
|
Issue: Soil erosion
·
Stabilize
eroding shorelines using vegetative and structural measures.
·
Encourage
reforestation of steep and erodible upland soils.
|
|
·
Number/% of
shoreline and stream banks affected by erosion.
·
Acres of steep
and erodible soils not in protective forest cover
and acres reforested
|
·
Number of
feet/miles of shoreline stabilized
|
|
Issue: Reducing Global
Warming
·
Understand County Forest land contribution to the global carbon cycle
|
|
·
County’s global
warming potential (CO2 equivalent).
|
·
Rate of
reforestation
·
% of energy
from renewables and clean fuel
|
Table B-4 Sample Sustainable Forestry Indicators
Organized using
Input-Output-Outcome Framework
|
Agency Goals
(i.e., Intermediate goals
that build toward Criteria from the MP C&I’s)
|
High-level Outcomes – How will you measure progress towards the goal
(i.e., indicators from MP C&I’s)?
|
Intermediate Outcomes –
(Portion of high-level outcome under your control) What impact
do your products and service have on achieving the goal?
|
Outputs –
What products and services
are the inputs/strategies producing to achieve the goal (i.e., Measure of
agency products and services)?
|
Inputs –
The resources and programs
your agency is using to strive for this goal (i.e., Time and $).
|
|
Provide essential habitat
elements for endangered species
|
Status of rare,
threatened, endangered species
|
% of operations w/
threatened and endangered species present that follow best management
practices
|
# of Operation contacts / written plans w/ threatened and endangered
present
|
FTE (number of Full-Time
Equivalent employees)
|
|
In working landscapes,
provide adequate levels of key habitat elements needed by wildlife
|
|
Percent of units inspected that meet standards for habitat elements
|
# of operations inspected
for best management practices
(i.e., snags, green trees, special sites)
|
FTE (number of Full-Time
Equivalent employees)
|
B-5. Input-Output-Outcome-Impact Framework
This framework allows linking indicators to the project cycle by defining indicators for every stage in it. For example, a program to reduce the PM10 (particulate matter size 10 microns) emissions from diesel buses may specify the following indicators:
- input: financial and/or technical assistance for PM10 reduction (measured in $)
- output: number or percent of new engines installed (cleaner buses)
- outcome: PM10 emissions from buses
- impact: ambient concentration of PM10 in the area; or incidence of respiratory diseases/lost workdays due to respiratory illness
Input indicators can be specified in terms of overall funds earmarked, specific tasks to be funded (e.g., new equipment, training). Output indicators relate to specific actions taken (such as hectares of forest designated as protected, introduction of substances with low or zero ozone depleting potential) and these would evolve from the design phase of the project.
Formulating outcome and impact indicators, however, is a greater challenge. Here is important to look both at the immediate and long-term impacts that a project is going to have on causal factors (pressures) and the condition (state) of the environmental/social problem.
This framework has been widely used by the World Bank to evaluate the effectiveness of environmental projects. It has also found significant application for evaluation of educational projects as well as some medical projects and programs (e.g., AIDS/HIV prevention).
The State of Oregon has used a different variation of the Input-Output-Outcome model that communities might find more useful, since it helps identify intermediate outcomes (i.e., a limited part of the high-level outcome) to track items that a community can directly influence. Table B-4 provides an example of this modified framework.
For additional information on this framework see www.worldbank.org/html/opr/pmi/envindi4.html
B-6. Lowell Center Indicator Hierarchy
This framework was originally developed by the Lowell Center for Sustainable Production, University of Massachusetts Lowell, as a tool to enable companies to evaluate the effectiveness of sustainability indicator systems. However, it can be used by communities as well. The framework consists of five levels for categorizing existing indicators relative to the basic principles of sustainability. The purpose of the framework is not to rank indicators as better or worse, but rather to provide a method to evaluate the ability of a set of indicators to inform decision-making and measure progress toward more sustainable systems of production or community development.
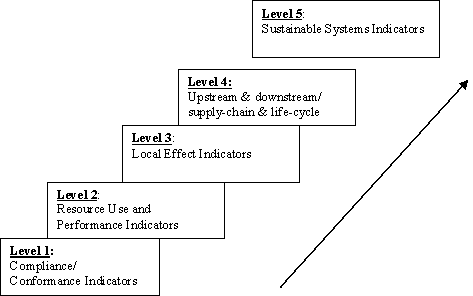
Figure B-3. Lowell Center Indicator Hierarchy
Underlying the LCSP framework are three basic assumptions:
- developing sustainable systems of production is a continuous, evolutionary process of setting goals and measuring performance;
- different companies and communities are starting at different places in the evolutionary process; and
- developing truly sustainable systems of production cannot be achieved by communities or companies alone but rather requires cooperation and coordination among them, government and NGOs at many different levels - local, regional, national and international.
These assumptions are reflected in the five levels of the hierarchy (see Figure B-3):
- Level 1: Compliance/Conformance
- Level 2: Resource Use and Performance
- Level 3: Local Effect Indicators
- Level 4: Upstream and Downstream/ Supply-chain and life-cycle Indicators
- Level 5: Sustainable Systems Indicators
Note that the levels are evolutionary, not exclusive. Many communities and organizations already have indicators that measure compliance or performance (Levels 1 and 2). As a community begins to consider and measure sustainable development, it will begin to develop indicators at higher levels, however this does not mean that indicators at the lower levels are no longer needed. It is necessary for communities to monitor compliance with regulations and standards (Level One) and the efficiency of their resource use (Level Two). However, in order to develop sustainably, a community needs to look beyond its boundaries at the impacts of suppliers, distributors and products (Levels Three and Four) as well as its contribution and connection to the overall sustainable economic, social and environmental system (Level Five).
For more information and examples of indicators within each of the five levels see: Veleva V., Hart M., Greiner T., and C. Crumbley, "Indicators of sustainable production," Journal of Cleaner Production, Vol. 9 (5), October 2001, pp. 447-452.
B-7. USFS Local Unit Criteria and Indicator Development (LUCID) framework
The purpose of LUCID was to:
- conduct a pilot study that would appraise the feasibility of monitoring sustainable systems at the forest management unit scale;
- provide forest managers and collaborators with feedback that can be used to improve Forest Land Management Plans;
- enhance collaboration between National Forests and other governmental agencies; and
- relate forest plan outcomes with regional and national C&I trends.
Six interdisciplinary teams working on eight National Forests were active in the LUCID Project and ranged from 500,000 acres to 17 million acres and from a single National Forest to three National Forests working within one ecoregional province. In keeping with ecological, social, and economic systems, the study areas were not just limited to National Forest System lands.
The monitoring approach for the LUCID Project was framed within a systems context. Systems-based frameworks draw from the three main components of sustainability - ecological, social, and economic - and indicators are organized within these domains based on systems theory. Systems theory suggests that systems are a group of interrelated, interacting, or interdependent constituents forming a complex whole. A systems-based framework uses the structures and functions of the systems as the organizing tools. It focuses on the contexts that allow for the production of goods, services, and opportunities to meet different values. Within a system framework the focus is on the outcomes or states of systems and not on inputs or outputs. This is particularly applicable to forests since they are joint production systems that simultaneously, not independently, produce soil, water, air, plants and animal material. This framework is most effective for ensuring coverage of the three systems from which sustainability emerges and for examining interactions within and among the three main components of sustainability.
The systems framework was hypothesized to be useful in two primary ways: first, it would better define the items for inventorying and monitoring; and second, it would provide an integrative model for synthesis and analysis of the inventory data. A systems framework establishes a logical link from sustainability to monitoring as it helps place the monitoring component in context. From a process perspective the systems framework is very useful because it provides a common starting point for collaborators and a means of building a common language about sustainability.
The frameworks used for selecting and developing C&I establish the logical relationship between the criteria and indicators and their measures. In the context of the LUCID Project, the social, economic, and ecological systems-based frameworks have a hierarchical architecture that is defined by principles and criteria. It is at the level of the measures or data for indicators where a more thorough examination of system interactions can be made. The use of this systems-based framework guided the development of indicators. For landscape systems they might include structure indicators that describe the size and shape of landscapes and process indicators that describe the causes or sources of change that result in the pattern within and between landscapes. Likewise, population systems might include structure indicators such as density, age class, and sex ratios and process indicators such as reproduction, mortality, and immigration/emigration rates.
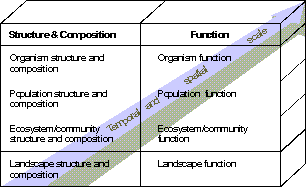
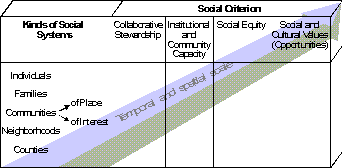
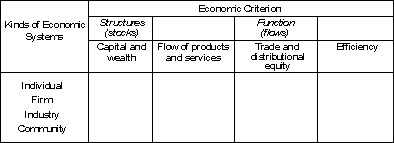
Final systems frameworks developed, tested and revised through the LUCID process are characterized by components assessing structural or stock components and functional or processes components of a variety of different types of system types across a range of scales. Graphic representation of the three systems frameworks are included in figures B-4 through B-6. Each of the cells in the frameworks represents criteria for which indicators were developed.
Details on the development, application and testing of systems frameworks in the LUCID process can be found in the final report at www.fs.fed.us/institute/lucid/final_report.
Figure B-4. Ecological Systems Framework
Figure B-5. Social Systems Framework
Figure B-6. Economic Systems Framework

|


